 BLOG| Creating Sentinel-2 RGB composite images in Python
 BLOG| The blocked Suez canal
 BLOG| Reed fire in Fonyód, Hungary
 BLOG| E-mail notifier for Sentinel-2 created in Python
 BLOG| This is how Kiszombor and Makó changed in 2020
 BLOG| The use of NDVI in agriculture
 BLOG| Trend analysis of ports at lake Balaton based on satellite images
 Latest satellite images of Kiszombor
 Latest satellite images of Makó
Types of data products published on Satmapper
PNG images
RGB, NDVI, NDWI and NDMI images in PNG format, created for the studied area. You can read more about these image types here.The created PNG images can be used primarily to examine changes between two capturing dates, or to create an animation showing the annual change.The date of image capture and the name of the examined area are shown on each image.
Interactive HTML maps

Interactive maps in .HTML format, in which RGB, NDVI, NDWI and NDMI indeces can be displayed. The file is compatible with every browser. You can read more about these indexes here. In each case, the file contains the date when the satellite image was captured, the name of the examined area and the color scale of the indexes. Internet access is required for proper display of the data.
Change detection

On the change detection images the differences between two consecutive images are highlighted with red color, helping the user to identify the changes. The analysis can be done on RGB, NDVI, NDWI and NDMI images. The file contains in each case the capture date of the two compared images and the name of the examined area.
About this website
Main profile of Satmapper.hu is the processing of images taken by the European Union’s Sentinel-2 satellites, with the aim of drawing attention to the social benefits of earth observation systems available to anyone today.
Satellite images captured on a 3-5 day basis can serve as a new tool for local administrations, farmers, water and forestry professionals, as they can be used to monitor large areas.
The Sentinel-2 satellites operated by the European Union’s Copernicus program carry a multispectral camera that captures reflected light from the Earth’s surface in 13 distinguished frequency range of the electromagnetic spectrum.
With different combination of these images, an RGB satellite image of the given area can be created, the wet and dry areas, the time evolution of the vegetation and the changes of the open water surfaces can be visualised.
The usability of the captured images is greatly influenced by the atmospheric conditions prevailing at the time of recording, as the satellite’s optical cameras do not “see through” the cloud layers, which means thatin a cloudy month much less data is generated.
You can read more about the website here.
Types of data published on Satmapper
During the development of the site, the primary consideration was to provide data that could be useful to agricultural and forestry professionals, municipalities or a particular community, therefore the following types of images were made available:
Red
Green
Blue

RGB satellite image
The RGB color composite images available on the site are a composition of the RED- GREEN- BLUE band images taken by the Sentinel-2 satellite, as is the case with most digital images.
The final image undergoes brightness and gamma correction, therefore the displayed colors may differ slightly from reality.
Useage of the RGB satellite image:
These kind of images provide a spectacular snapshot of the examined area, making a lot of detail become visible.

Satellite image
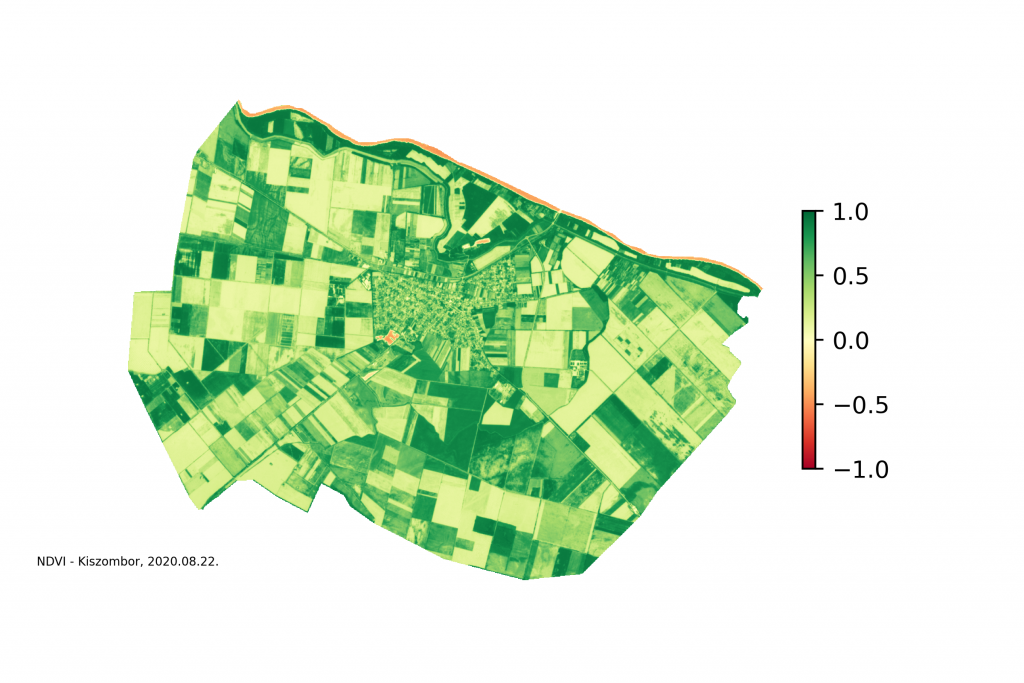
NDVI

NDVI - Normalized difference vegetation index
NDVI is one of the most commonly used indices in precision agriculture. Its value is calculated from the ratio of the RED and NIR (near-infrared) light reflected by the vegetation on the surface. If the studied area is covered with healthy vegetation, the reflected red light decreases compared to near-infrared, while in the case of withered plants, the two lights are reflected in almost equal proportions.
NDVI map values can range from -1.0 to + 1.0 and can be calculated as follows:
NDVI = (NIR-RED) / (NIR+RED)
By assigning the color scale shown below the images to the NDVI values calculated from the satellite images, the areas with different vegetation can also be visually separated.
- The greener an area, the higher its vegetation index, which indicates that the area is covered with healthy green vegetation, and photosynthetic activity is adequate.
- Pale green or yellowish areas indicate reduced or no photosynthetic activity. In reality, these areas are typically fields without vegetation (e.g., roads, buildings, fallow land) or where vegetation is under stress (e.g., suffering from nutrient or water deficiencies, possibly affected by pests or diseases). Vegetation still in the growing phase as well as the ones that are just drying up appear in the same color.
- Areas marked in red and orange may indicate water surfaces, lakes, rivers, or snow.
Usage of NDVI satellite image:
It helps to monitor the development of vegetation over time (e.g. monitoring of the condition of crop areas, detection of illegal logging), shows whether there are stressed plants within an area, thus helping with targeted irrigation, spraying or fertilization.

Satellite image
NDWI

NDWI - Normalized difference water index
With the help of NDWI, open water surfaces such as lakes, rivers and inland waterbodies can be visualized.
Its value is calculated from the ratio of the reflected GREEN and near infrared NIR (near-infrared) light.
NDWI map values can range from -1.0 to + 1.0, but are often displayed between -0.8 and +0.8.
NDWI values are calculated as follows:
NDWI = (GREEN-NIR) / (GREEN+NIR)
Where a significant amount of water is present, the NIR value decreases since water absorbs the near-infrared spectrum excellently, resulting an NDWI value around +1.0.
The color scale below the images is designed so that values below 0 are not visible, only those above, aiming for a better visualistaion experience. By assigning NDWI values calculated from satellite images to the color scale, the water-covered areas become visible.
- The darker the color of a marked area, the greater the amount of water is indicated by the NDWI map
Usage of NDWI satellite image:
It helps identify larger waterbodies like lakes, rivers and inland waters.
By monitoring the NDWI over time, we can get an idea of the continuous changes in the bed of our lakes and rivers.

Satellite image
NDMI

NDMI - Normalized difference moisture index
With the help of the NDMI index, we can obtain information on wet and dry areas, which can help in the economical irrigation of plants.
NDMI values can be calculated in several ways, but for Sentinel-2 satellites, it is advisable to use Narrow NIR and SWIR (short-wavelength infrared) images for the calculation.
NDMI map values can range from -1.0 to + 1.0, but are often displayed between -0.8 and +0.8.
NDMI values are calculated as follows:
NDMI = (Narrow NIR-SWIR) / (Narrow NIR+SWIR)
The magnitude of the Narrow NIR reflection coming from the surface depends on the condition of the leaves of the vegetation, but does not depend on their water content, while the reflection value of the SWIR is greatly influenced by the water content in the leaves.
By assigning NDMI values calculated from satellite images to the color scale below the images, wet and dry areas become visible.
- The darker the color of the examined area, the higher the moisture content.
- Green areas refer to urban environments or artificial roads.
- Areas sloping from yellow to red indicate a dry surface.
Usage of NDMI satellite image:
It helps to monitor the moisture content of the surface. Using NDMI, the areas to be irrigated as well as the parts affected by drought become visible.
The data published on the Satmapper.hu website is for information purposes only!
Click on the button below to learn more about this website or the Sentinel-2 satellites